M1MT: Interactive map of resource supply – is a mapping web resource whose functionality provides for the accumulation, processing, storage and operational display of the level of provision of a territorial community or administrative region with a certain type of resources, obtaining the necessary spatial and numerical information from the database, based on the current needs of the user. The main task of the interactive map is the implementation of information support for the development of an optimal model for the use of land resources, the solution of the existing problems of resource security.
M1MT: Interactive map of resource supply
Features of the interactive map
Use the most convenient way to display the current state of provision of the administrative region or territorial community with natural, land and recreational resources. Achieve efficiency in the visualization of qualitative and quantitative information, exclude work with cumbersome tables and numerical data, and instead illustrate the indicators in an accessible form for the user.
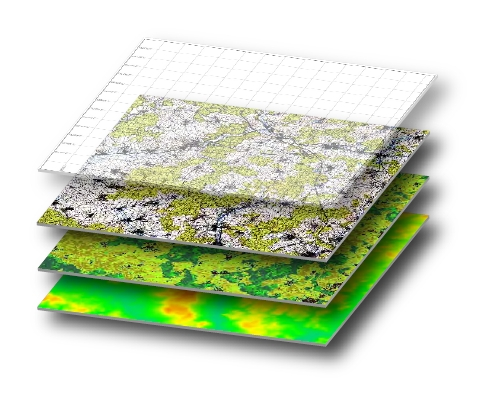
Map functionality provides for navigation, data editing, operating with vector layers and cartographic basis, spatial analysis, address search by administrative units (village councils, districts), etc.
To work with an interactive map, the user does not need specialized programs and qualifications of a GIS specialist, it is enough to have a web browser and Internet connection. Use the ability to quickly access information through the map application – geographic information system and synchronized with it mobile app.
Interactive map of resource supply at the land administration service
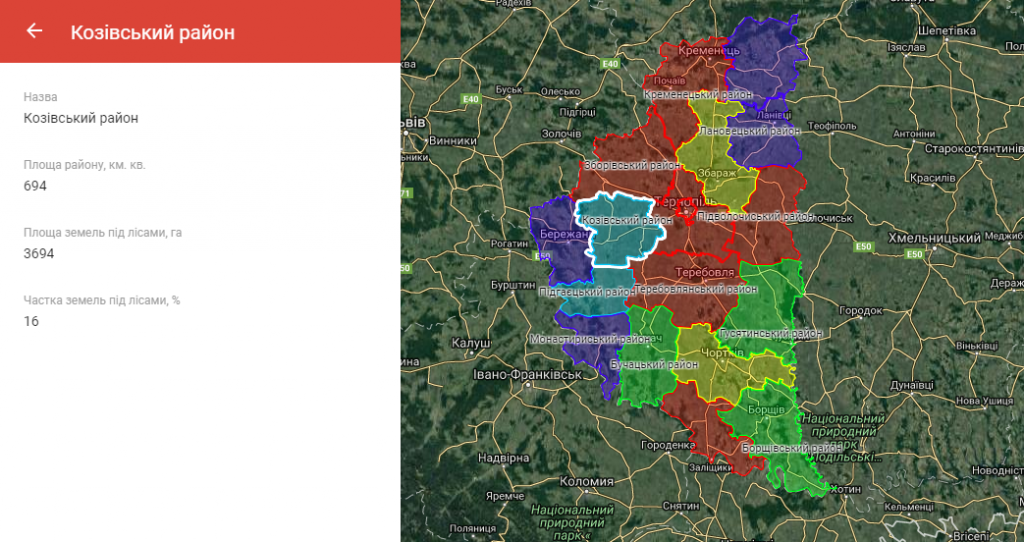
- get reliable and comprehensive information about the state of the available land resources of the administrative region in the context of village councils / territorial communities;
- analyze the dynamic changes in the structure of land resources over a long-term period;
- explore the structure of the land fund, identify the main problems of land use of the area and plan strategic tasks to solve them;
- use the interactive map to justify management decisions taking into account the fact that production resources need to be acquired (attract, build, etc.) in order to achieve maximum effect together with the existing ones without harming the environment while improving working and living conditions for people.
Interactive map of resource supply provides for the thematic layers displaying
- the provision level of the territory with agricultural land (arable land, pastures, hayfields, perennial plantings, etc.);
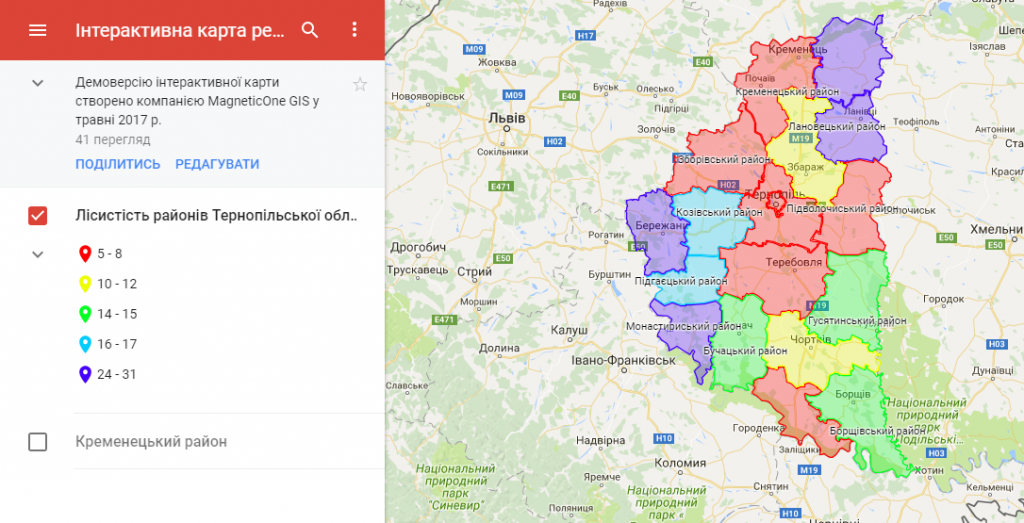
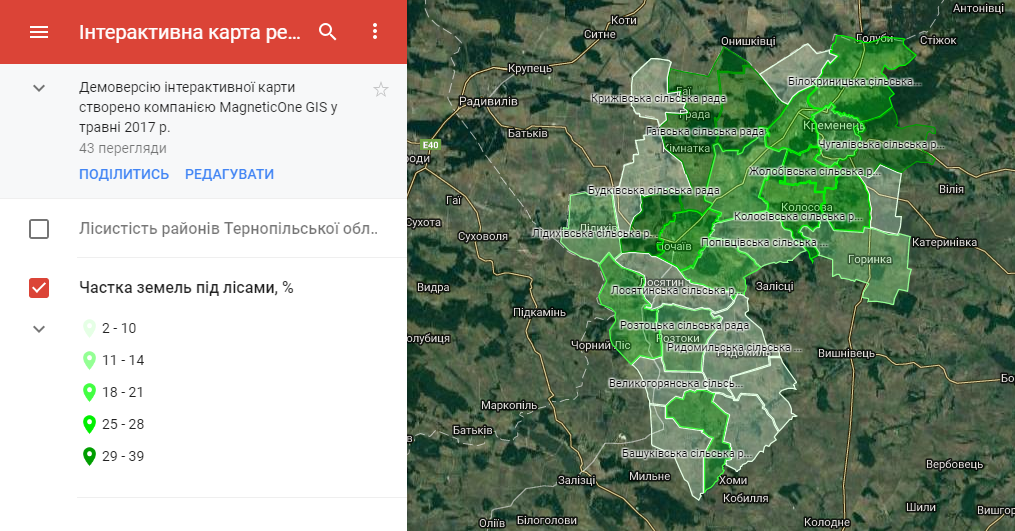
- the provision level with forest resources: forests as a whole or their separate categories;
- the nature of territory development (residential development, industrial land, territories used for waste disposal, the recreation of the population, etc.);
- provision of water and recreational resources, minerals;
- provision of conservation lands.
Requirements, cost and timing of the order
The main source of information for creating an interactive map of resource security and the formation of a corresponding electronic database is the “Report on the availability of land and its distribution to land owners, land users, lands and types of economic activity”. The cost of creating an interactive map is calculated based on the number of thematic map layers, branching of the database, as well as individual customer wishes. The deadline for creating a web map is up to 30 days from the date of the provision of the necessary materials and the signing of a cooperation agreement.


